Segregation and Health in Atlanta
By Matthew McCurdy
Introduction
Residential segregation by race has been named a fundamental cause of health disparities. Research has found associations between residential segregation and adult mortality, infant mortality, poor birth outcomes, and self-rated health. This relationship between residential segregation and health is more prominent when considering the interaction between racial and income segregation. Often residential segregation creates pockets of minority, low-resource communities. The pathways linking residential segregation are numerous and interconnected; the effects of racism, the distribution of resources including wealth, employment, and social capital, the context and quality of the segregated neighborhoods, and access to medical care are all effected by levels of segregation.
Atlanta, Georgia has experienced residential segregation on a wide spread level. With one of the highest populations of African Americans in the United States, the city ranks in the top 25 for two measures of segregations. Additionally, blacks in Georgia experience higher rates of poor health outcomes, including, years of potential life lost, higher infant mortality rates, higher rates of breast and prostate cancer, diabetes, AIDS/HIV prevalence, and low birthweight. This four-part series will explain the history of segregation in Atlanta and its impacts on black-white health disparities.
Measuring Residential Segregation
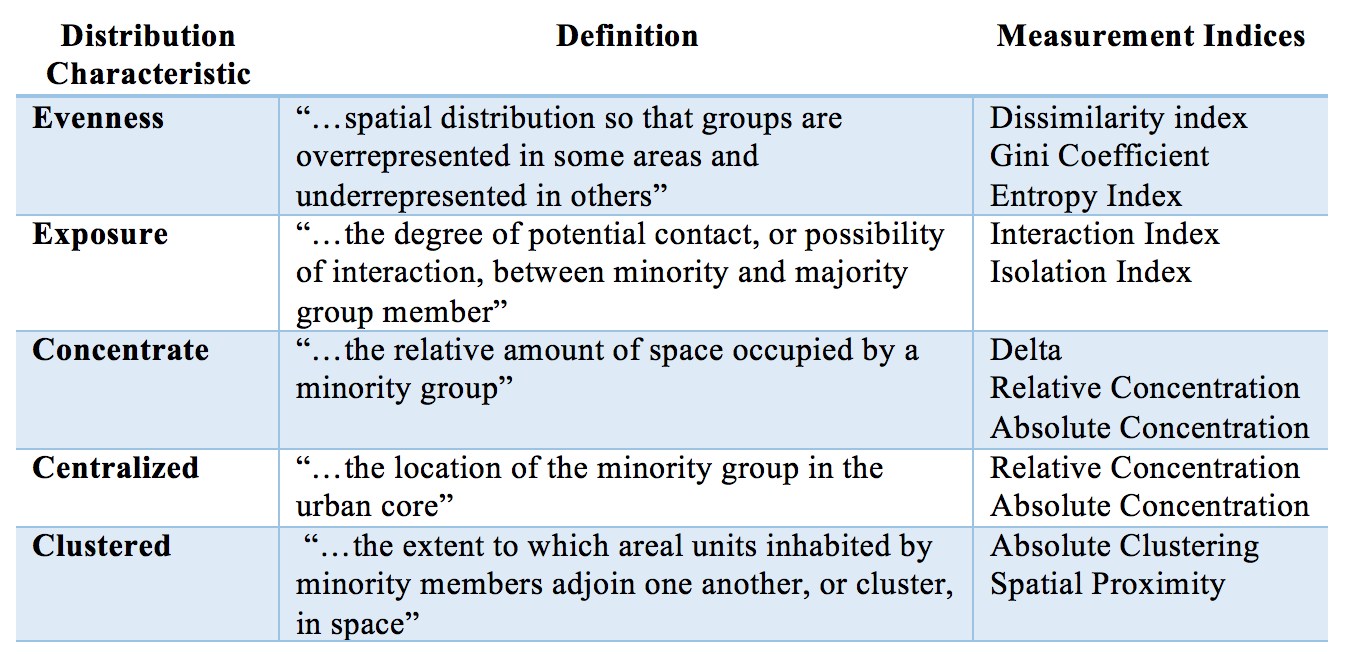
In general terms, residential segregation is the degree to which two or more groups live separately from one another in the context of a defined urban space and the process that creates the differential distribution of people. This definition, however, does not encompass the complexity related to the actual manifestation of segregation; groups can be segregated in a variety of ways. Within the residential segregation literature, researchers have debated which distribution characteristics most accurately describe residential segregation and which indices correctly measure segregation. Massey and Denton completed an extensive search to identify different measures of segregation and found five prominent dimensions of segregation: evenness, exposure, concentration, centralization, and clustering. The table below defines the different distribution characteristics and measurement strategies related to segregation.
The most common index used to measure segregation is the dissimilarity index. This measurement of evenness assesses representation and spatial distribution of groups on a scale of 0.0 to 1.0, with the more segregated urban areas receiving higher scores. Generally, a dissimilarity index value above 0.60 is thought to represent extremely high segregation. It should be noted that, although the five spatial dimensions of segregation is an empirical concept residential segregation incorporates each of the five underlying aspects of spatial variation defined in the above table. Individuals can experience multiple forms of segregation simultaneously.
Residential Segregation: The United States Context
During the slave trade there were an estimated 6 to 7 million slaves imported to the New World; approximately 400,000 of those slaves were brought to the southern colonies. The slave trade drastically altered the racial demographics of the antebellum South, and nearly one-third of the population was comprised of black slaves. Slavery existed as a legal institution in the United States for 246 years. During this time, it was generally the law of the land that slaves were not allowed to make money, were forbidden from learning how to read and write, and were physically and mentally abused at the will of their owners. The ramifications of these practices led to generations of black men and women who only knew the brutality of servitude and physical punishment, while many white citizens were able to flourish and establish wealth.

Photo Credit: Atlanta Journal Constitution
After the Civil War, the 13th Amendment was adopted and officially abolished slavery; however, freed African Americans faced a precarious situation in the post-antebellum South. Legally, former slaves received the rights of citizenship and the equal protection under the Constitution in the 14th Amendment and the right to vote with the 15th Amendment; however, the provisions stated in the Constitution were often ignored or violated by local and state governments. This made it difficult for former slaves to gain a foothold in post-war political, social, and economic spheres. In an effort to gain some autonomy and avoid regressive contractual labor arrangements like sharecropping, many freed slaves left rural areas for urban cities like Atlanta. During this time Atlanta saw an increase in its black population from 20% of the population in 1860 to 45% in 1870. Former slaves often could not afford to live in the same places as the white citizens of Atlanta; thus, de-facto segregationmanifested in Atlanta’s neighborhoods.
After 1860 du-jure segregation manifested through enforcement of Black Codes and legislation like the Jim Crow Laws, which, among other things, further limited the neighborhoods where black people were able to buy homes. Much like the quality of the separate but equal public facilities, Black people were not permitted access to the most desirable residential areas. In the subsequent years following legally mandated segregation, there was a mass exodus of black people from southern states for manufacturing opportunities in northern cities, later known as The Great Migration. There is evidence that at this time Blacks may have decided to live around majority blacks for the advantageous reasons for jobs, access to cultural and religious institutions and social support. Researchers label this time, 1890 to 1940, the rise of the black ghetto, with an increase in the percentage of black neighbors for the average black person from 27% black to 43% black.
In response to the changing demographics of their cities, after 1940 many northern white communities adopted restrictive housing covenants constraining the sale or rental of properties to non-whites. Additionally, federal housing polices pushed black people into pockets of low-income and poverty. The Federal Housing Authority (FHA), the primary funder of housing loans in the middle 1900s, would not provide loans for black to move out of inner-city ghettos and into suburban homes. Conversely, at this time there was demographic transition of whites leaving city-centers in favor of suburbs due to loans from FHA. Realtors and private loaners followed government actions and continued to steer blacks into predominantly black neighborhoods. Additionally, blacks who were able to buy homes in predominately white neighborhoods were often subjected to property damage and physical violence. From 1940 – 1970 discriminatory policies and collective acts of racism institutionalized white supremacy, limited the social mobility of black people, and ultimately led to increases in the levels of black-white segregation.
The Civil Rights Act of 1968 made discrimination in the sale or rental of housing units illegal, but studies reveal that subtle and explicit discrimination in housing persists. Nationally, the index of dissimilarity for the United States declined from 0.70 in 1990 to 0.59 in 2010, with the biggest declines occurring in the cities with the least amount of black people. Cities with a large population of black people, like Atlanta, still have high levels of segregation (above a dissimilarity score of .60).
Black-White Segregation in Atlanta
Atlanta, Georgia is one of the largest cities in the United States and has long been considered a central hub for economic, political, and cultural opportunity for African-Americans. According to the the 2010 US Census, 54% (226,894) of Atlanta’s 420,003 residents are black or African American. Atlanta has been heavily populated by black people since freed slaves migrated to urban areas at the end of the Civil War and the passing of the Thirteenth Amendment. From 1860 to 1870, the city of Atlanta saw an increase in its black population from 20% of the population to 45%.

Integration / Black-White Segregation Index
Atlanta continued to see its African American population grow as the city and its citizens played a central role in the Civil Rights movement. Despite the political and social gains during the Civil Rights movement, segregation grew during this time. Wins at the lunch counters and buses had no impact on the integration of neighborhoods. In fact neighborhoods became more segregated. Recently, the city has seen an influx of migrants, including African Americans, into the city. This incoming flow of people is concurrent with recent migration rends. Labeled the New Migration, many Southern cities are seeing an influx of college aged singles and middle-income families moving back (as the antithesis to the 1910 Great Migration). Atlanta is attractive to many incoming people because of its relative housing affordability and strong academic opportunities.

Dot Map of Atlanta's Race Distribution
Despite the perception of diversity and economic development in Atlanta, recent trends and data show that the longtime African American population in the city is not as well off as one may think. As a result of historical policies like Black Codes and Jim Crow, structural limitations that prevent social mobilization, and often dilapidated social conditions, Atlanta is currently one of the most racially segregated major cities in the United States; the citywide diversity does not correlate into integration within neighborhoods. As table above shows, Atlanta has a residential segregation / integration score of -14.5%. Lower numbers on this scale indicate that local neighborhoods are less integrated and are less reflective of citywide diversity.
Additional measures of the racial segregation assess the spatial distributions of black people across metropolitan Atlanta. The Index of Dissimilarity (a measure of evenness) and the Isolation Index (a measure of exposure) show a similar neighborhood segregation trend. According to data drawn from the 2010 Census, Atlanta has a Dissimilarity Index score of 58.3. This means that 58.3% of Atlanta’s black population would have to move to different neighborhoods in order to fully integrate the city. Additionally, based on the same 2010 Census data, Atlanta has an Isolation Index score of 58.1, meaning that 58.1% of Atlanta’s African American citizens live in an area that is majority black. Atlanta ranks in the top 25 cities for both of these measures. Atlanta’s racial segregation was visually captured in the dot map of Atlanta’s citizens. There are some integrated communities; however, there is a clear divide between Atlanta’s black and white neighborhoods.
Furthermore, Atlanta’s segregation based on race correlates to income and economic segregation. Economic segregation can be assessed by surveying the distribution of incomes across neighborhoods, census tracts, or counties. A recent report by The Brookings Institute found that income separation was higher in Atlanta than any other American city, with a 95th percentile to 20th percentile income ratio of 19.2. This means that the 95th percentile of Atlanta’s residents make approximately 19 times as much as those who fall in the lower 20th percentile.
While the city of Atlanta may have more economic opportunity for black people, there are large gains to be made in terms of neighborhood integration and economic mobility. As black people are pushed out of high quality neighborhoods due to property value increases, it is imperative that we understand how neighborhood quality can impact health.